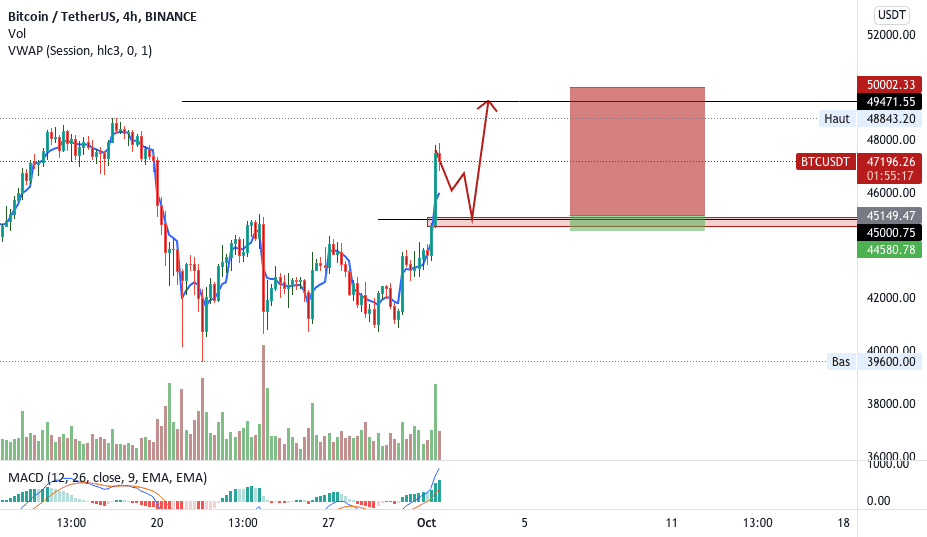
analyse btc par BOUMAHDIi
after btc peak penetration 45k and get highr i’ll wait to Re-test 45k again and buy

after btc peak penetration 45k and get highr i’ll wait to Re-test 45k again and buy
Day 3 on my journey : “read the market”
Daily charts
Objective was to watch the market and try to identify point of interests
Thats what i’m going to do all this week
Take my time , and try to “decrypt” all of this
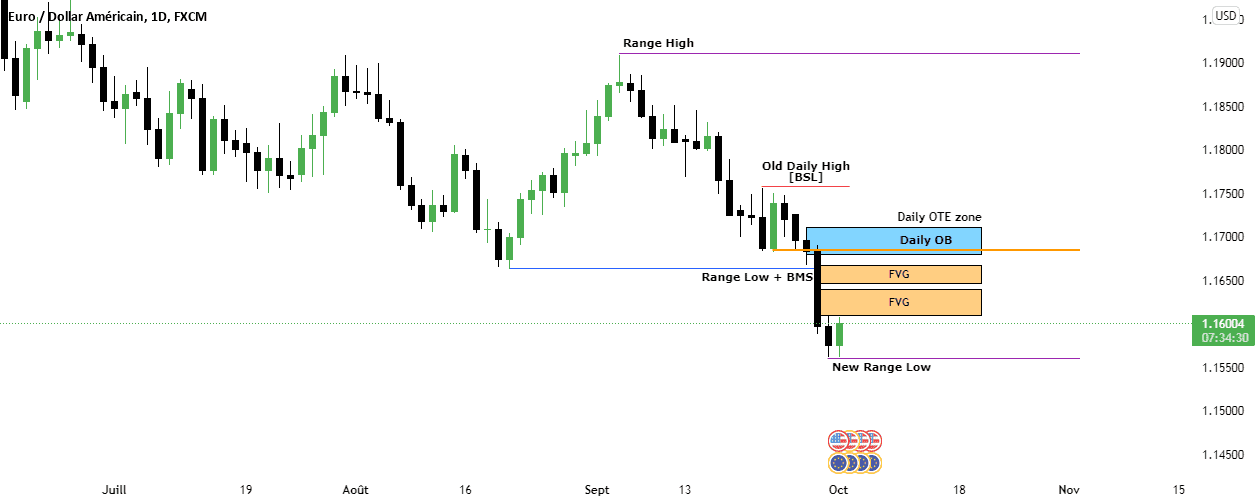
what i see on this chart ?
A downtrend + a break in the market structure
As i saw the BMS i’m looking for a retracement .
Watching the last bull candle before the quick down movement
I identify a daily bearish order block then i use fibonnaci on the last swing high to swing low to locate an optimal trade entry zone.
I find some fair value gap in the 4H chart , inside the quick down movement liquidity void
In this scenario i imagine that the price will go up to fill the liquidity void and the fair value gap , then at a fair value i expect it to push down again .
But watch out for the Old daily High Buy stop liquidity who might be taken before the price continue to go down .
Training diary
01/10/2021 – 09:21 NY time (gmt+4)
EURUSD
thank you for your reading
please know that your feedback is greatly appreciated and we can talk about these NOOB observations ^^
Mathy
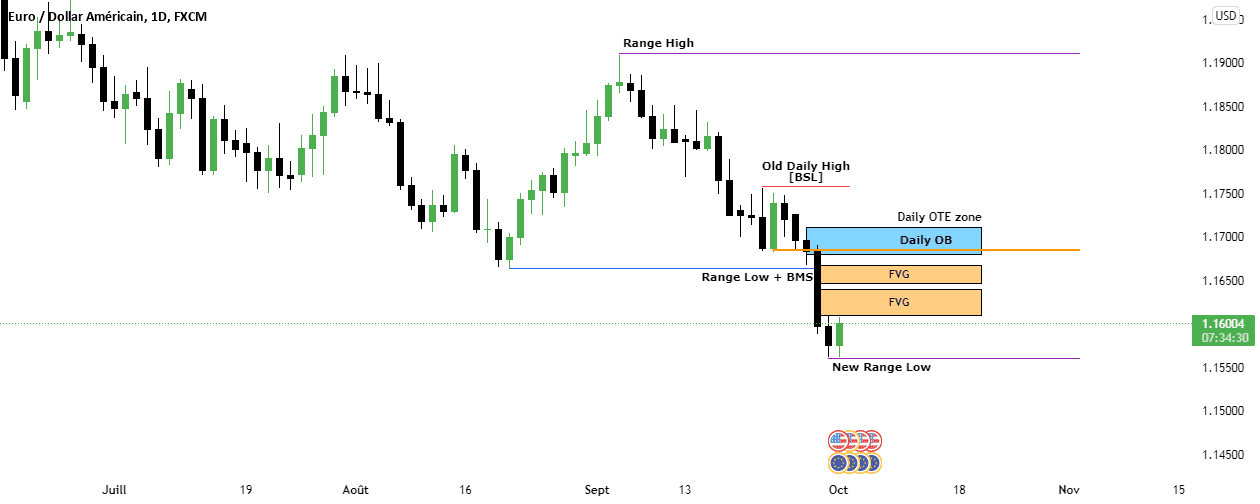

I would not be surprised if we retrace to lower levels during the month of October, which could trigger a lot of stop losses and liquidation .
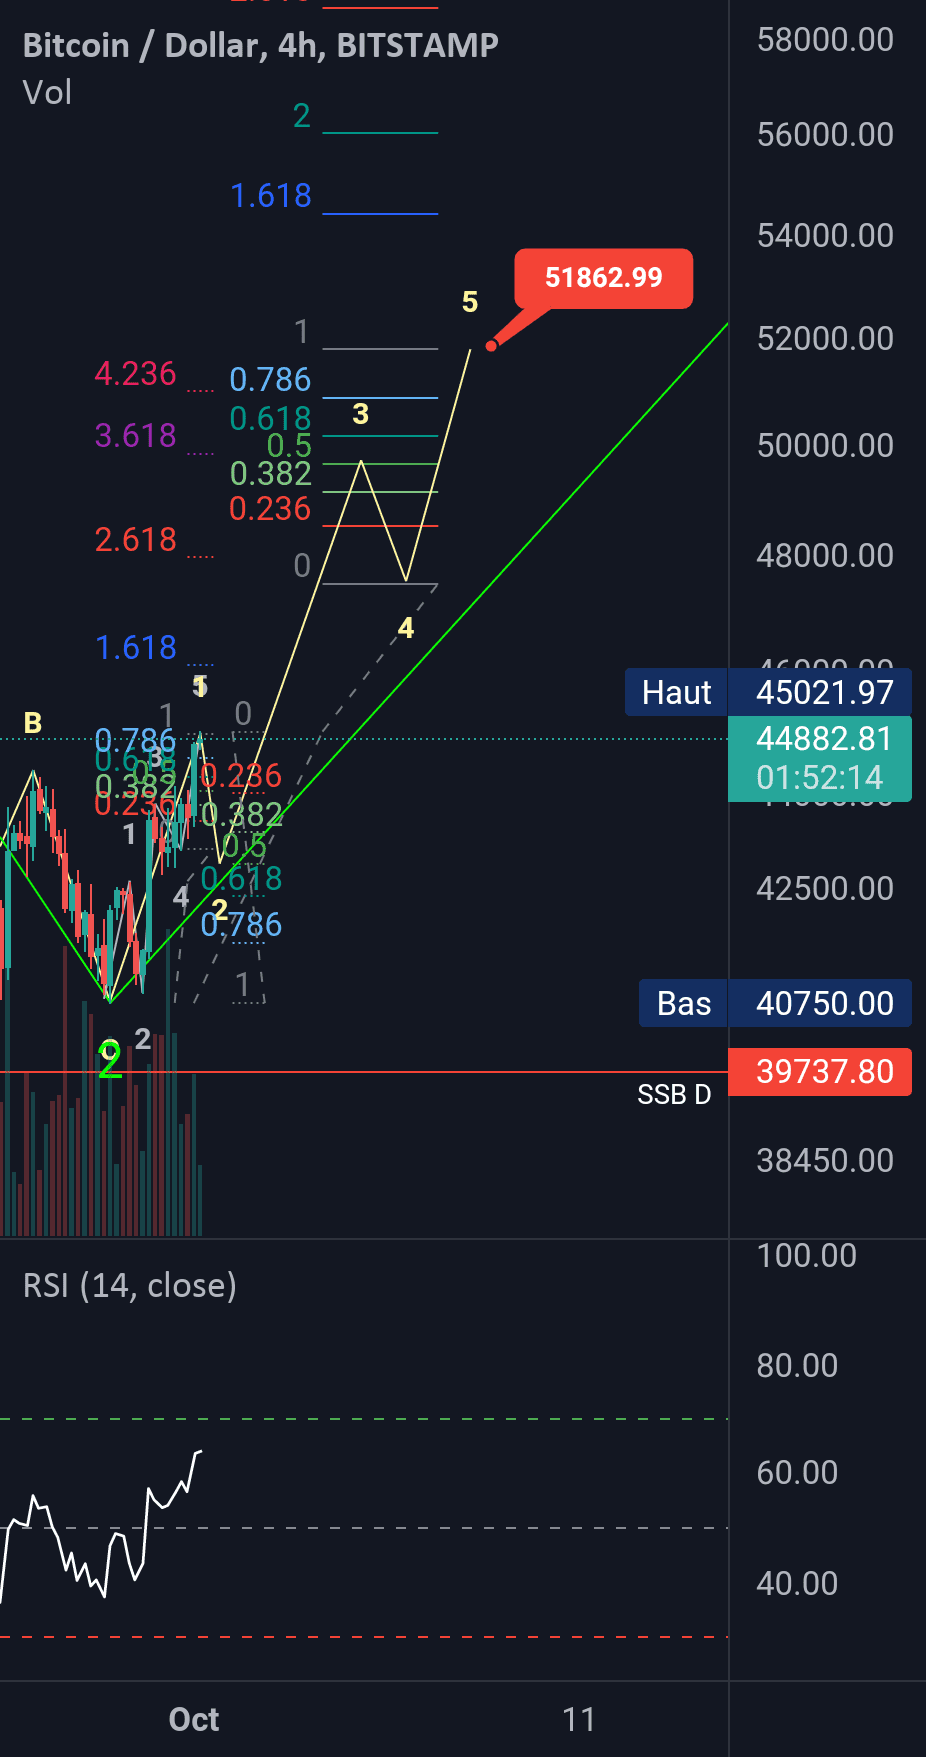
La reprise haussière du bull-run a-t-elle commencée ?
Cela n’est pas improbable du tout.
Le premier objectif en UT 1H/4H est $51800 minimum avec des ratios de Fibonacci classiques (50% W2, 161.8% pour W3 et 100% pour W5).
Toutes les planètes s’alignent… S&P qui edt sur le point de repartir à sa hausse, le DXY à la baisse. Le rebond du cours sur la forte résistance (plat SSB en daily) autour des 40000. La structure Elliottiste qui forme une impulsive haussière en 1H. Le Hash Ribbons. Le RSI qui est dans une position idéale pour le break-out. Bien sûr un dernier dump n’est pas impossible et il faut rester prudent mais le scénario présenté ici commence à devenir de plus en plus probable.
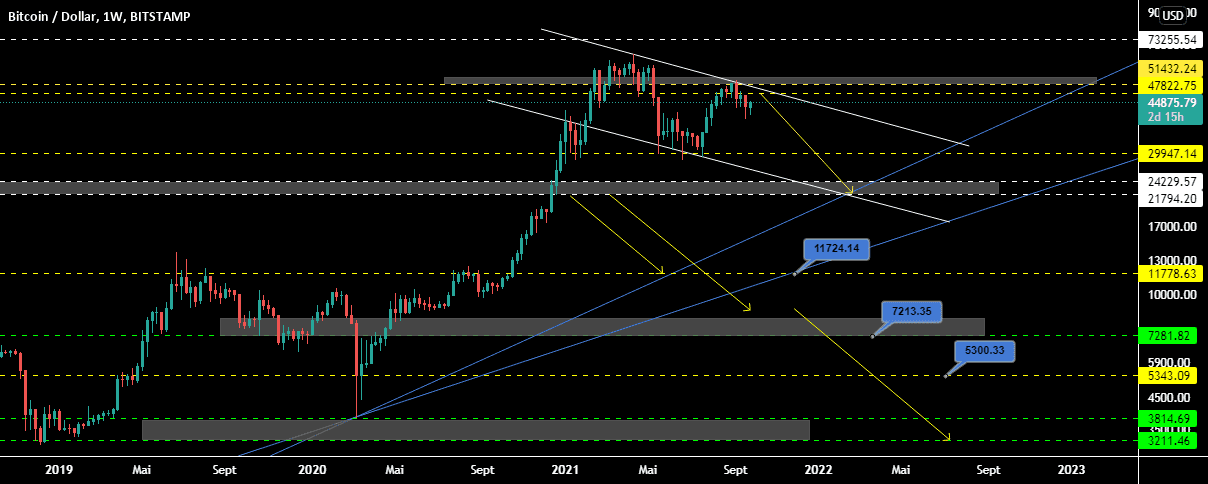
Update and continue the previously published analysis…
All indicators and models are negative and it is now on its way to form a top that is smaller than a top and a bottom that is less than a bottom….
The general trend is strong selling, and there is no support or positive signals that support entering into buying.
The best decision is to freeze and enter into the sale deal.
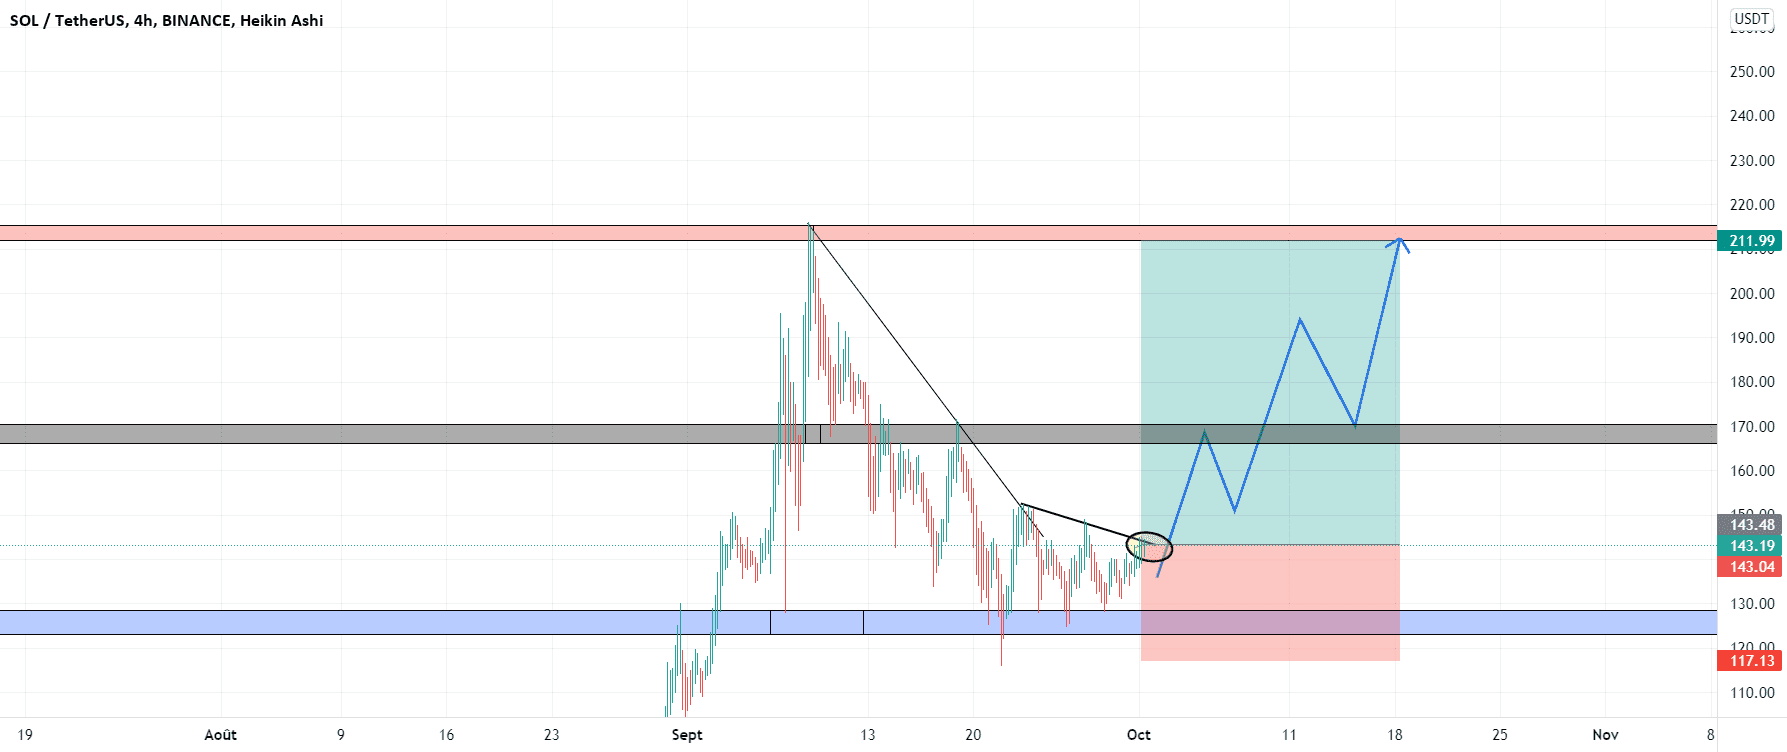
bonjour je rentres acheterur sur sol usdt je vise le dernier plus haut en premier tp
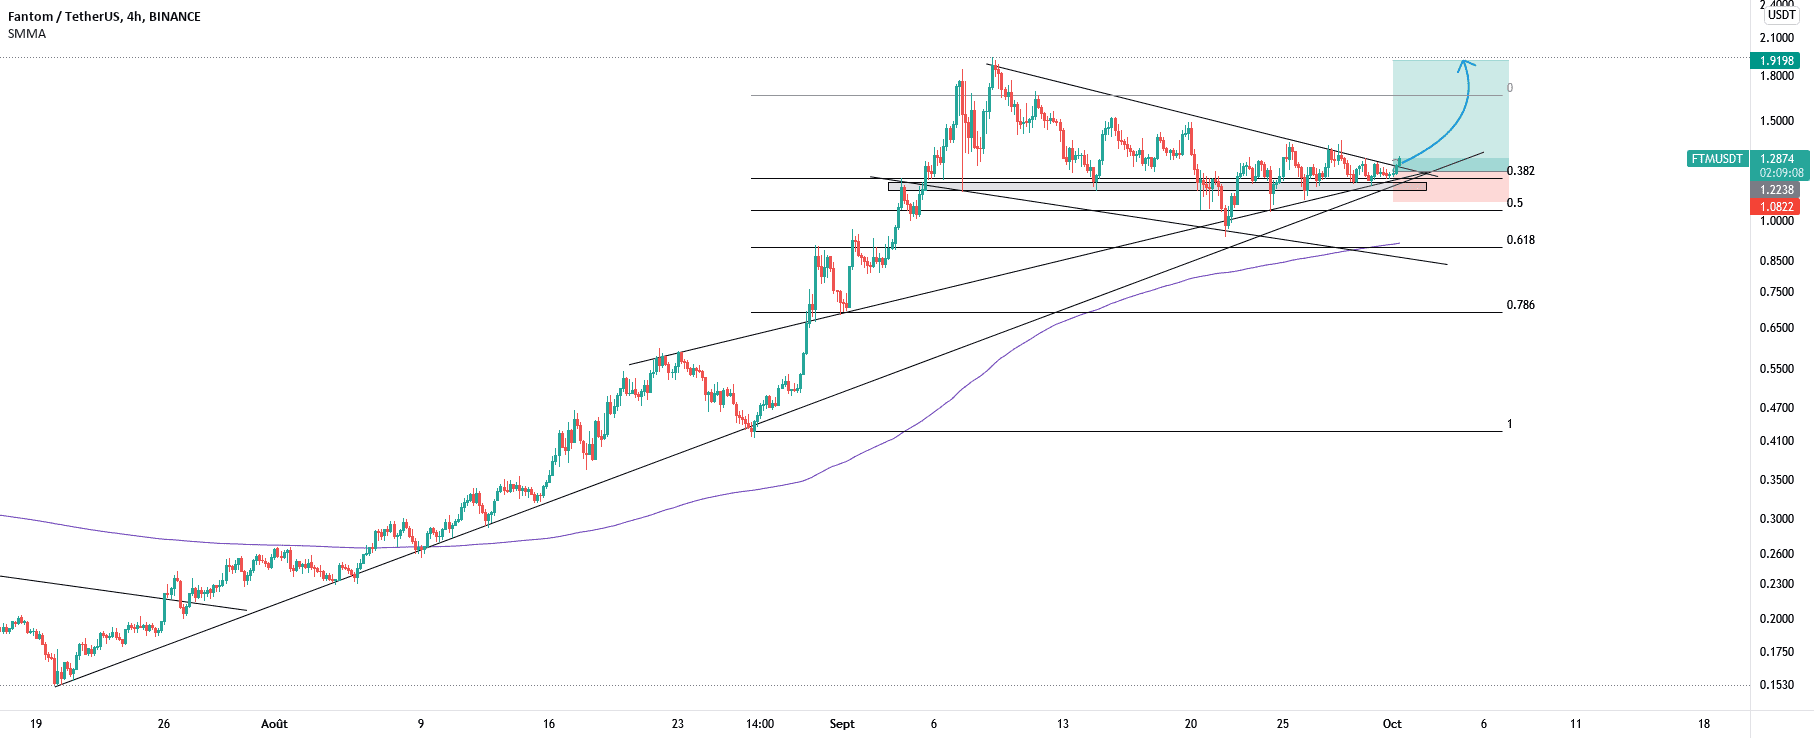
Cassure du drapeaux de corrections sur niveaux fibo rebond sur support et trendline daily
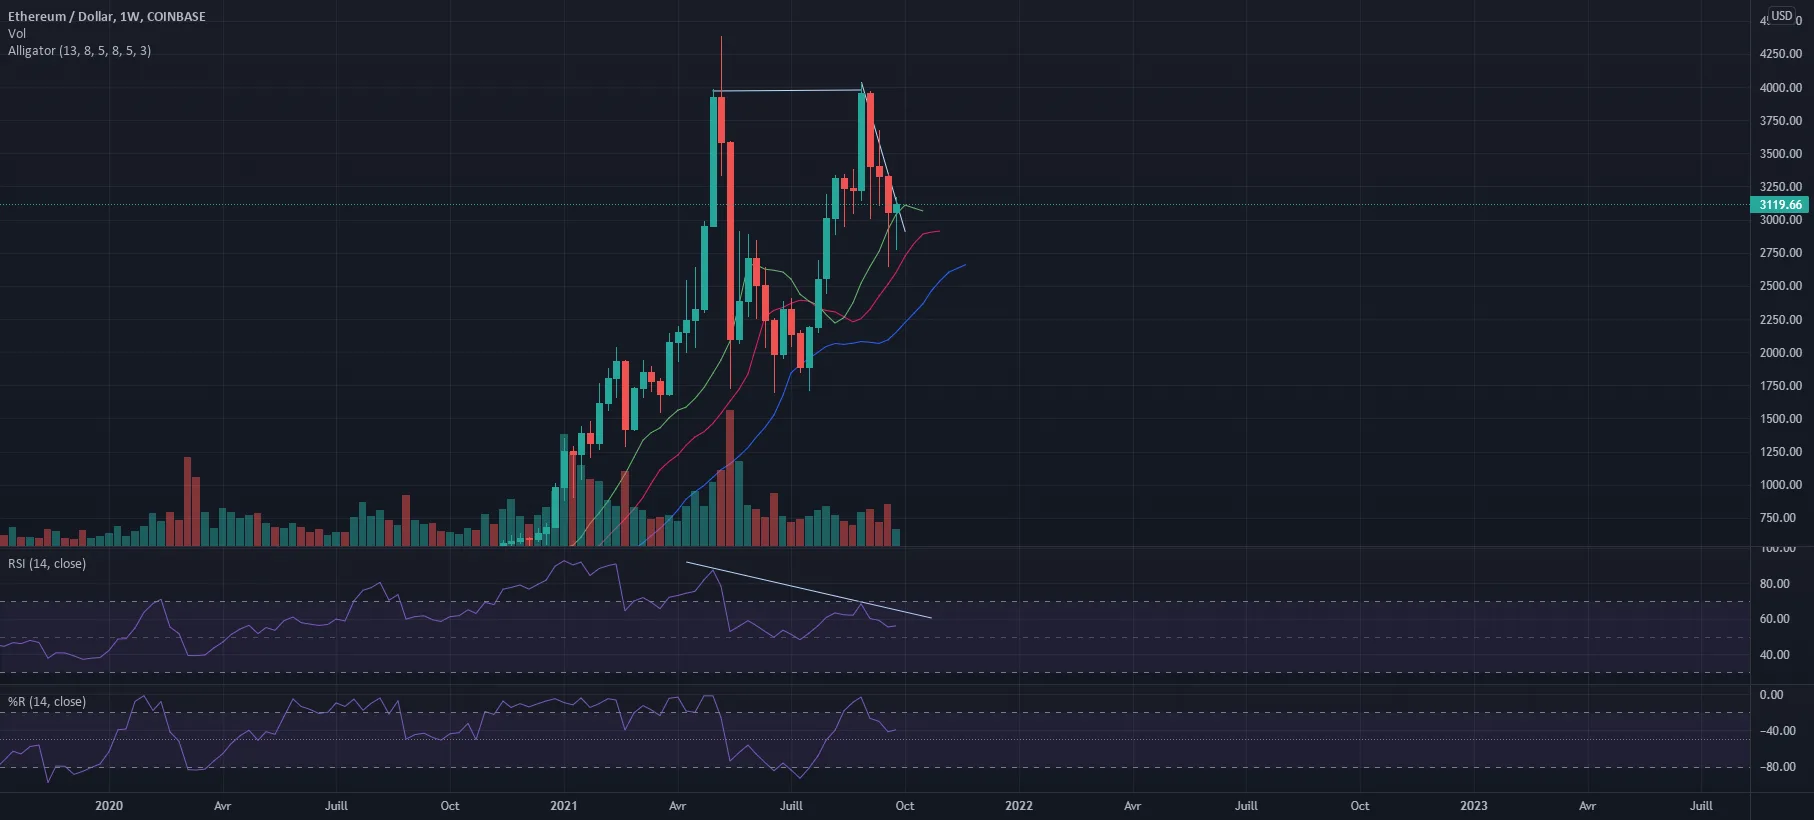
Malgré tout le bruit bullish, on voit clairement une divergence baissière sur l’ ETH en weekly. De plus on peut apercevoir l’alligator qui est repu et commence à se refermer. La formation d’un M en cours ou une future anse pour la tasse déjà formée : ce qui dans ce cas nous enverrais vers de nouveaux ATH. Pas de trade long terme, quelques uns à prendre en daily sur les compressions intra fibo.