forex.fr

EUR/GBP Breaking the Daily Consolidation par ThinkingAntsOk

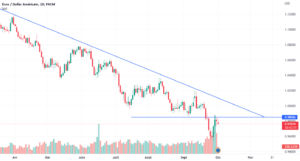
Good day traders! Today we want to show you our daily chart analysis of the EUR/GBP pair, since it is behaving in an interesting way and we consider it important to take it into account. 🔸As we can see, for more than a year the price has been in a clear downtrend. 🔸All support zones along the way have been penetrated. 🔸About a month ago, the 0.8700 zone was broken, and then the price for almost 30 days was in a consolidation period. 🔸At this moment, it is generating a break in the bearish direction, which, if confirmed, could start the next impulse. 🔸The target of the movement is in the next support zone, at 0.83000. There is about 200 pips of travel towards that level.
EUR/GBP Breaking the Daily Consolidation pour FX:EURGBP par ThinkingAntsOk

Good day traders! Today we want to show you our daily chart analysis of the EUR/GBP pair, since it is behaving in an interesting way and we consider it important to take it into account.

🔸As we can see, for more than a year the price has been in a clear downtrend.

🔸All support zones along the way have been penetrated.

🔸About a month ago, the 0.8700 zone was broken, and then the price for almost 30 days was in a consolidation period.

🔸At this moment, it is generating a break in the bearish direction, which, if confirmed, could start the next impulse.

🔸The target of the movement is in the next support zone, at 0.83000. There is about 200 pips of travel towards that level.
Good day traders! Today we want to show you our daily chart analysis of the EUR/GBP pair, since it is behaving in an interesting way and we consider it important to take it into account.

🔸As we can see, for more than a year the price has been in a clear downtrend.

🔸All support zones along the way have been penetrated.

🔸About a month ago, the 0.8700 zone was broken, and then the price for almost 30 days was in a consolidation period.

🔸At this moment, it is generating a break in the
bearish direction, which, if confirmed, could start the next impulse.

🔸The target of the movement is in the next
support zone , at 0.83000. There is about 200 pips of travel towards that level.

Lire la suite sur TradingView

Améliorez vos compétences de trading en vous inspirant des idées de traders du monde entier.
Avertissement au risque

Veuillez noter que les CFD sont des instruments complexes et présentent un risque élevé de perte rapide de fonds en raison de leur effet de levier. 75 % des comptes de traders particuliers perdent des fonds lorsqu’ils tradent des CFD avec ce fournisseur. Vous devriez vous demander si vous comprenez bien comment les CFD fonctionnent et si vous pouvez vous permettre de prendre le risque important de perdre votre argent.

Les performances passées ne sont pas une indication des résultats futurs.

Les crypto-actifs sont susceptibles de subir d’importantes fluctuations de prix et ne sont donc pas appropriées pour tous les investisseurs. Le trading de crypto-monnaies n’est supervisé par aucun cadre réglementaire européen.


Il y a toujours une corrélation entre rendement élevé et risque élevé. 

forex.fr ou toute personne ayant un rapport avec forex.fr n’accepte aucune responsabilité pour toute perte liée à la spéculation ou tout préjudice lié à la confiance sur les informations contenues sur ce site y compris les données, les cotations, les graphiques et les signaux d’achat et de vente. Veuillez être pleinement informés sur les risques et les coûts liés à la spéculation sur les marchés financiers, c’est l’une des formes de placement les plus risqué.

Laissez un commentaire!

A propos

forex.fr est un site d’information sur le marchee des changes. Le contenu n’est pas pas une recommandation d’investissement.

Articles recents

Inscrivez-vous a notre newsletter

En vous inscrivant vous acceptez notre politique de confidentialite.

Pas de spam, pas de courrier indesirable

Recevez un plan d'investissement Crypto personalisé