


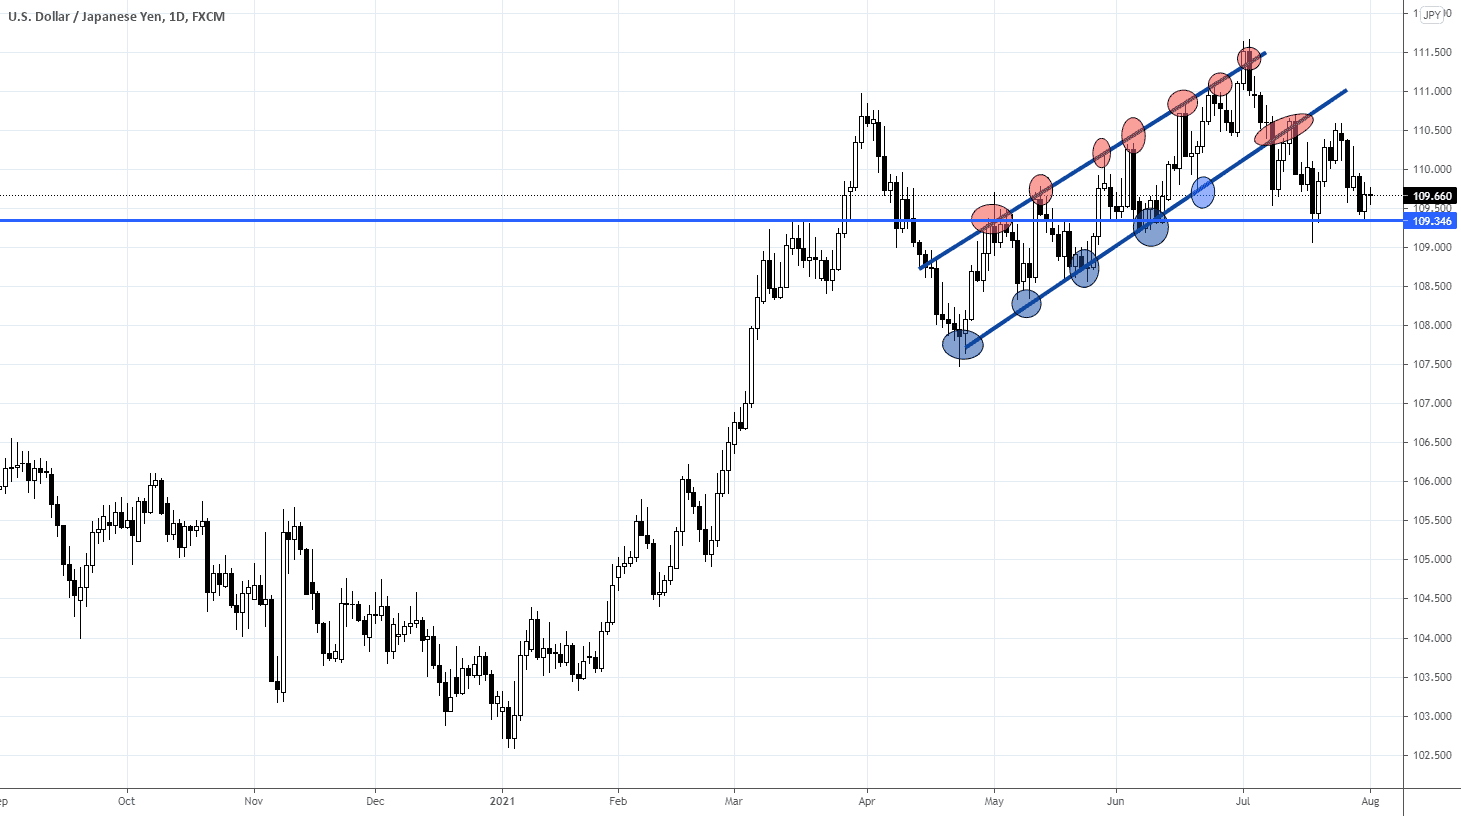
USDJPY facing bearish pressure | 02 August 2021 par FXCM
Price IS approaching pivot in line with the horizontal swing low support and the 61.8 % Fibonacci extension level. Should price break this level, we can expect price to plunge further to take support at the 100% Fibonacci extension and the 161.8% Fibonacci retracement . Our bearish bias is further supported by how price is holding below the EMA .
Any opinions, news, research, analyses, prices, other information, or links to third-party sites contained on this website are provided on an “as-is” basis, as general market commentary and do not constitute investment advice. The market commentary has not been prepared in accordance with legal requirements designed to promote the independence of investment research, and it is therefore not subject to any prohibition on dealing ahead of dissemination. Although this commentary is not produced by an independent source, FXCM takes all sufficient steps to eliminate or prevent any conflicts of interests arising out of the production and dissemination of this communication. The employees of FXCM commit to acting in the clients’ best interests and represent their views without misleading, deceiving, or otherwise impairing the clients’ ability to make informed investment decisions. For more information about the FXCM’s internal organizational and administrative arrangements for the prevention of conflicts, please refer to the Firms’ Managing Conflicts Policy. Please ensure that you read and understand our Full Disclaimer and Liability provision concerning the foregoing Information, which can be accessed on the website.

Range trading: Forex as of 02/08/2021 par Trade24Fx
Calculations of the fluctuations range for the present day are published in this section. That is, at the very beginning of the day, you can determine the maximum and minimum of this day (with a known probability).
What does this information give? In fact, a lot. But first of all, these are guidelines for trade. For example, if during the day the price approaches the upper (lower) mark, you know that it won’t go above (below) this mark with a particular probability today. Accordingly, you can open a position opposite to the current movement, knowing in advance what the probability is to be profitable.
EURUSD
https://www.tradingview.com/x/Wlt7Fv0H/
Long position 1
(the price today will not fall below this mark with a probability of 68%) 1.1818
Long position 2
(the price today will not fall below this mark with a probability of 95%) 1.1797
Long position 3
(the price today will not fall below this mark with a probability of 99%) 1.1776
Short position 1
(the price today will not rise above this mark with a probability of 68%) 1.1914
Short position 2
(the price today will not rise above this mark with a probability of 95%) 1.1934
Short position 3
(the price today will not rise above this mark with a probability of 99%) 1.1955
GBPUSD
https://www.tradingview.com/x/AjdPwqlJ/
Long position 1
(the price today will not fall below this mark with a probability of 68%) 1.3816
Long position 2
(the price today will not fall below this mark with a probability of 95%) 1.3787
Long position 3
(the price today will not fall below this mark with a probability of 99%) 1.3757
Short position 1
(the price today will not rise above this mark with a probability of 68%) 1.3975
Short position 2
(the price today will not rise above this mark with a probability of 95%) 1.4004
Short position 3
(the price today will not rise above this mark with a probability of 99%) 1.4033
USDJPY
https://www.tradingview.com/x/M0LiHPy9/
Long position 1
(the price today will not fall below this mark with a probability of 68%) 109.23
Long position 2
(the price today will not fall below this mark with a probability of 95%) 109.02
Long position 3
(the price today will not fall below this mark with a probability of 99%) 108.80
Short position 1
(the price today will not rise above this mark with a probability of 68%) 110.09
Short position 2
(the price today will not rise above this mark with a probability of 95%) 110.31
Short position 3
(the price today will not rise above this mark with a probability of 99%) 110.53
Calculations are based on historical data, and there is no history recurrence on a specific day. We remind you that the indicated probabilities values aren’t a 100% guarantee of risk-free trading.

LONGUEUR X 25 FLUX D’ORDRES DE HAUTE PRÉCISION par ANTICRIPTOVENGANZA
Binance / Bitmex
Durée x 25 Temporalité 1 heure
Contrats à terme BTC à effet de levier
Point d’entrée : USD 39000
Cible : USD 43000
Stop Loss : USD 38100
L’effet de levier est extrêmement risqué et doit être exécuté avec de l’argent que nous sommes prêts à perdre ou à toucher au stop loss.
Laissez un commentaire utile ou encourageant. Ensemble, nous pouvons dominer les marchés.

Huge sell potential EUR/JPY par howard1996
After breaking that trend line, market will probably be rejected by one of these three level of interest. On it reaches. On of them, scale down to a lower time frame to trigger a the best entree possible the Risk reward ration is insane here. Let’s be patient and see how it goes


USD/JPY ??? par YohannTrad-Crypto
– Bonjours,
. Je vous partage seulement mon analyse en court terme sans description,
. Un avis neutre en attente de voir sa direction pour prendre une positon .
Bonne semaine.