forex.fr

ACtualites du marche des changes

WHERE IS GOING BITCOIN ? pour BINANCE:BTCUSDT par GhostInTheShellTwenty

WHERE IS GOING BITCOIN ? par GhostInTheShellTwenty

Hi,

In my last analysis I was on a bullish bias with the possibility of retesting a string down around 38k. I proposed to monitor the breakout RSI and momentum, which did not take place for the entry into position.
The bitcoin have follow the market (S&P500) and have a very strong bearish structure.

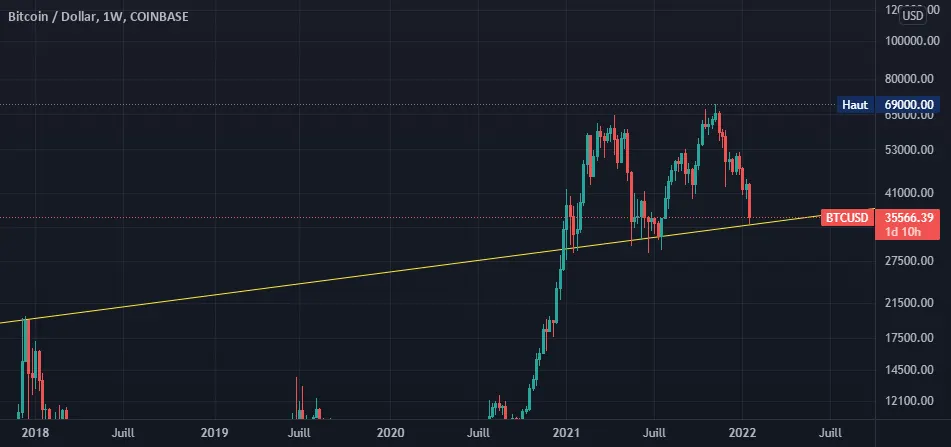
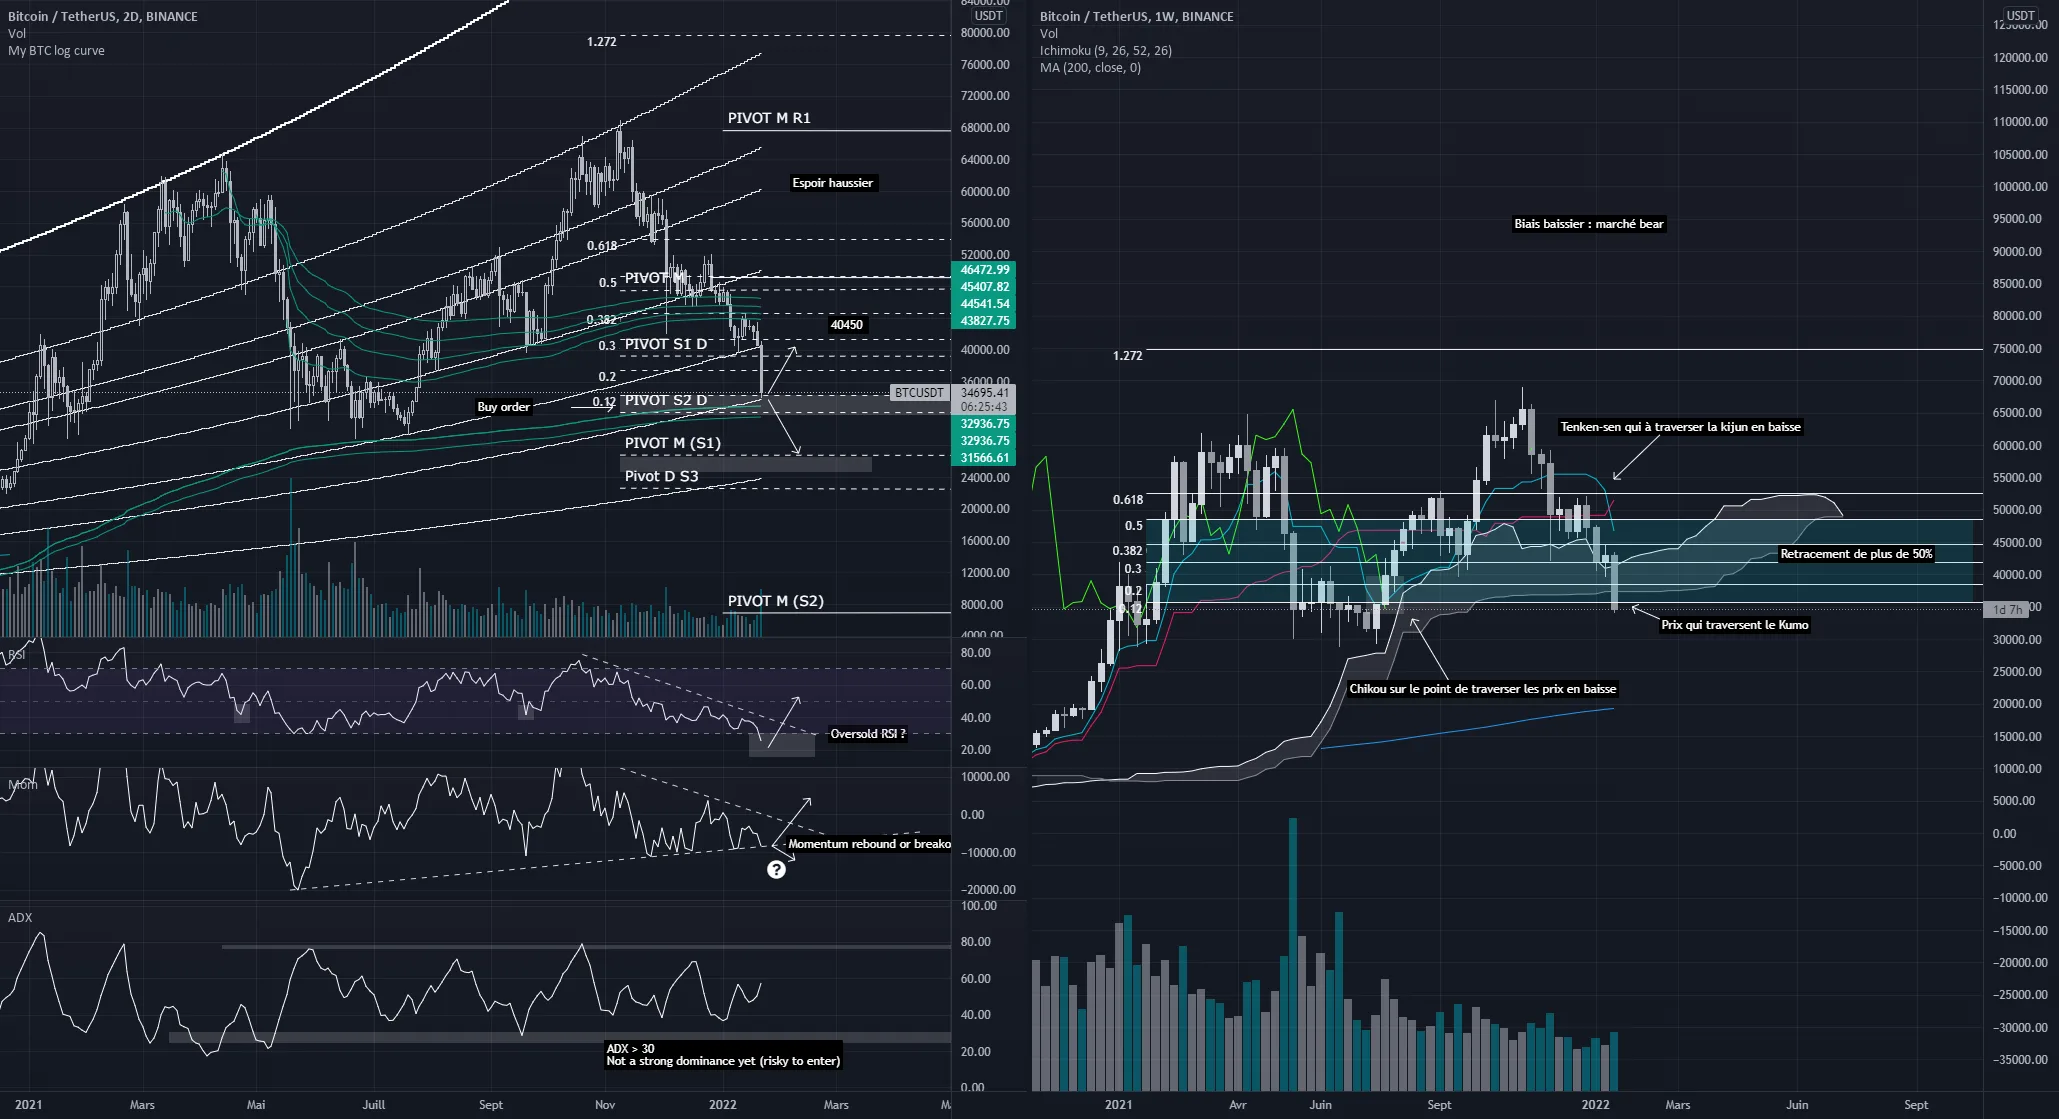
Weekly analysis (BEARISH MOVEMENT):
During the week, we can observe the Kijun is about to cross the falling prices which may suggest a decline in prices to come.
We can see that prices are also crossing the KUMO which could signal a strong bearish state.
The tenkan-sen crossed the falling prices (which is weak bearish signals, but combine with others it’s not good news).
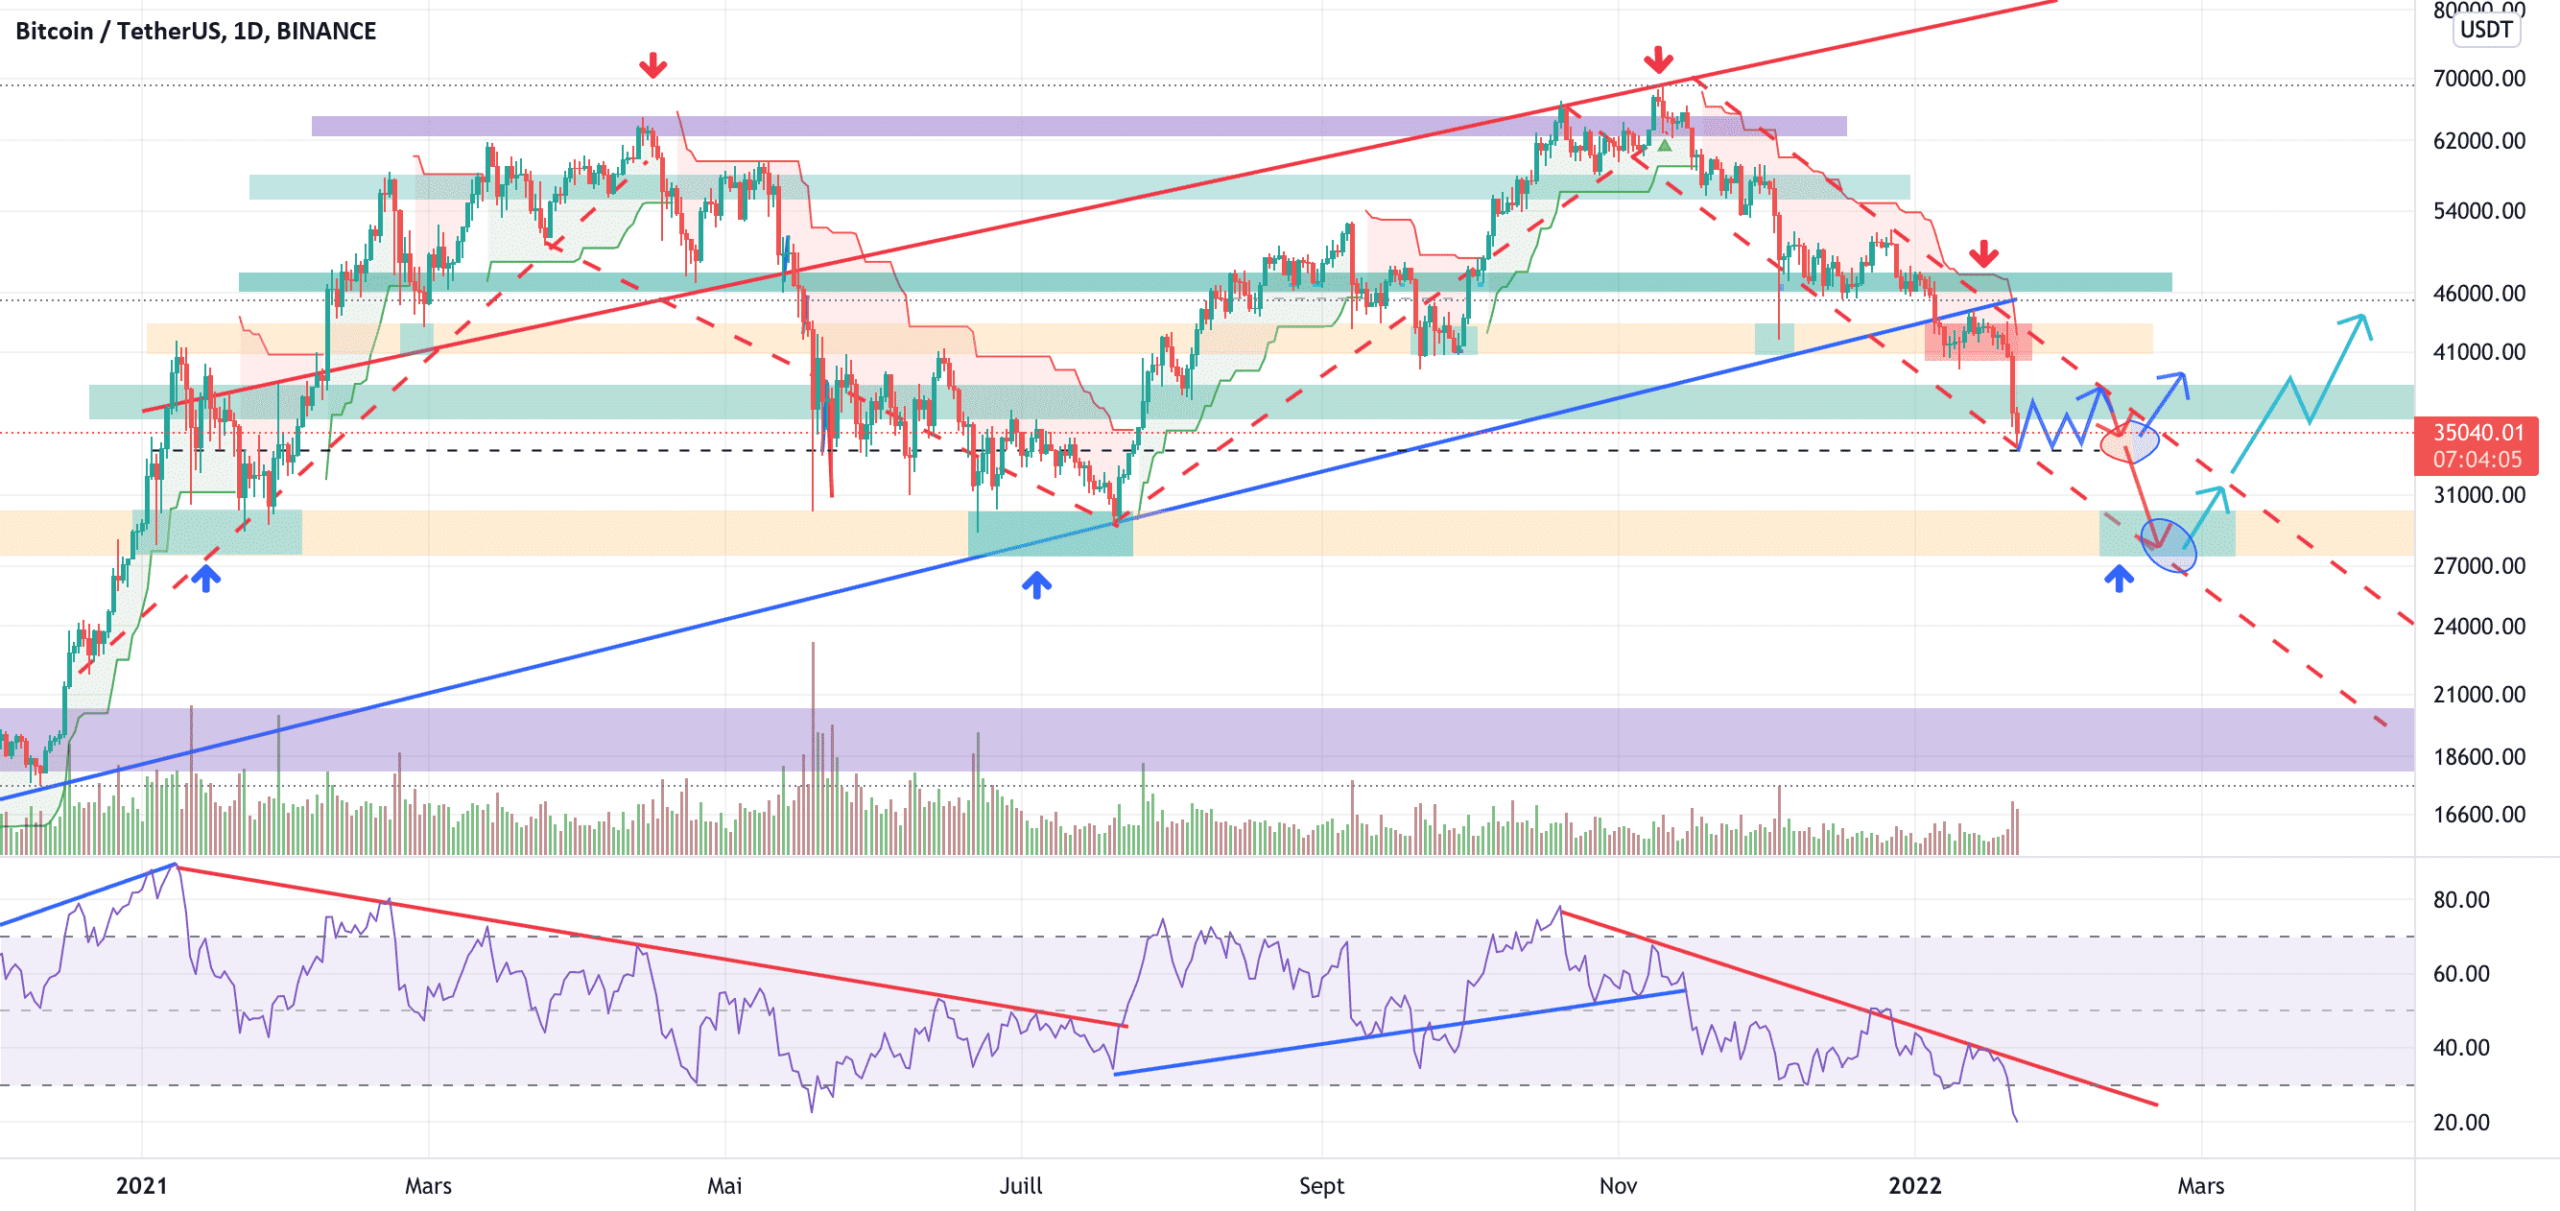
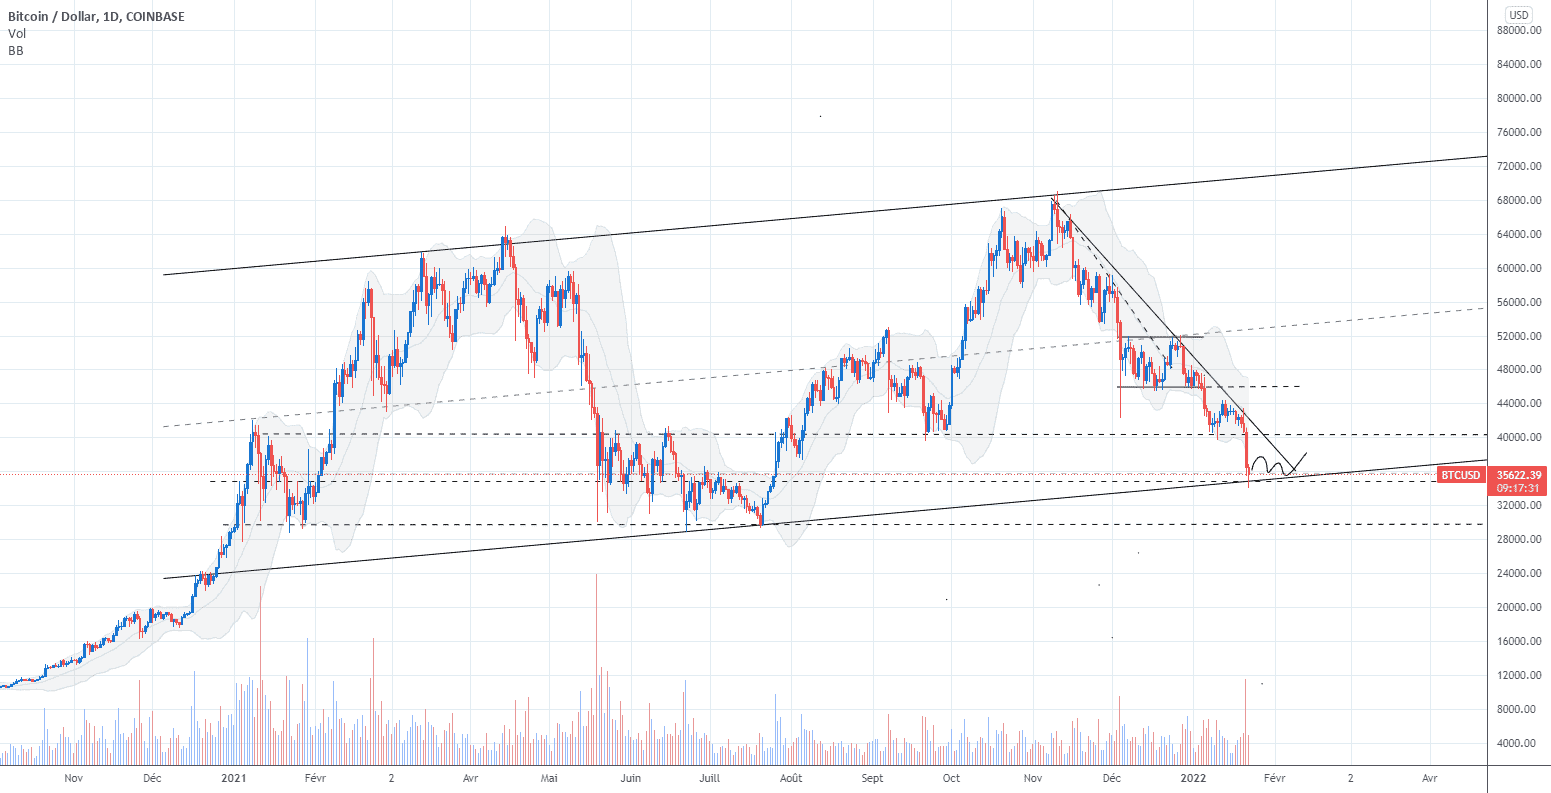
Daily analysis :

We crossed the 200 exponential moving average on January 15, which is strong bearish signal.
We have 3 black crows (Candle patterns, strong bearish signal).

The logarithmic formula of BTC announces a possible rebound on current prices, we could then imagine a rebound to KUMO (pullback) 37281.
The RSI show us a strong oversold area which mean, it can be good for an entry.

Strategy :
If you are short, wait the pullback to the Kumo, if you are long it’s very risky because we are against the strong dominance, but you can try a long to the buy zone 34200 -34700 .
I strongly suggest to wait the momentum indicator, (wait for a breakout !) if we have bearishcross then you can short, if we have rebound, it will be a signal to try a smart long.

In any case be very careful,

Lire la suite
BTC/USDT toujours dans une config baissière pour le moment (D1) pour BINANCE:BTCUSDT par YohannTrad-Crypto

BTC/USDT toujours dans une config baissière pour le moment (D1) par YohannTrad-Crypto

Bonjour à tous,

– Je vous partage une analyse graphique sur le Bitcoin : BTC/USDT en D1.

– Une mauvaise news à causer une baisse des marchés financiers (Forex / Crypto / Action). ce qui à pousser le prix en dessous de la zone des 40K.
– Depuis le depuis du mois de Novembre on aperçois déjà que le marché est dans une TD baissière avec ce canal baissier.
– Le marché suit alors une descente entre le support baissier et cette résistance baissière jusqu’à aujourd’hui.

– Après cette cassure à la baisse du support des 40K je pense qu’il est fortement possible que le prix redescendre.
– Il pourrait venir à la zone de support des 27K – 30K pour rebondir et reprendre une possible reprise haussière.

scénario possible :
– Le marché dois reprendre des volumes/ si les grosses baleines défendent et rachètent la zone des 30K alors ont pourrait s’attendre à un rebond.

Pire scénario :
– S’il ne défendent pas ce niveaux, il suffirait de quelques mauvaises news pour que le prix du BTC baisse jusqu’a cette grosse zone de résistance des 19K – 20K.

– RSI : EN D1 le RSI est actuellement à 20.30 ce qui indique qu’il est (Sur-vendu).

– Voici une analyse graphique sur la sur cette baisse que tout le monde redoute depuis 2 semaines.
– Si tu as une question, alors n’hésite pas de laisser un commentaire.
– Je vous souhaite une bonne journée malgré encore une journée rouge en crypto-monnaie.

Lire la suite
TradingGroungdhog - Milking FOMO Strategy pour BINANCE:SHIBUSDT par TradingGroundhog

TradingGroungdhog – Milking FOMO Strategy par TradingGroundhog

As FOMO are always gems among the crypto community, we need to take care of them. They tend to drive the market to interesting tops and sometimes disappointing bottoms. However, their ability to stimulating the market volatility is amazing. With the idea of jumping between bottoms and tops resulting from an important bull run, a strategy was born.

Simply stated,
the idea seeks to find, by extrapolating the line crossing 2 fractal tops, an interesting entry price.
This entry price tend to be a bottom in correlation with a previous price of indecision, one for which bull and bear were fighting.
Once these requirements validated, the buy signal can be sent.

To define the sell signal, latest indecision market price have to be study, the price with the strongest probability of being the common TP will be our TP.
To find it, simple, look at the latest Secondary Top or indecision market period.

This methods can be repeated multiple times for the same Lead Top, using the multiple Secondary Tops resulting from it.

Lire la suite
Bitcoin pourrait trouver son bas de marché sur les 35000$ pour COINBASE:BTCUSD par Manaril

Bitcoin pourrait trouver son bas de marché sur les 35000$ par Manaril

Si le niveau clé des 30000$ est une hypothèse très partagée pour un potentiel coup d’arrêt du Bitcoin, l’analyse technique semble mettre en lumière une alternative

Un canal tracé comme ci contre est cohérent tant avec les deux hauts de marché décalés qu’avec la zone médiane du canal, qui est fréquemment réputée être une zone de support-résistance
Il est visible sur ce graphique que cette dernière a joué un rôle pivot à plusieures reprises
Le bas du canal est sur les 35000$ actuellement qui a été une zone pivot lors des deux précédents ranges à ce niveau

Si rien ne confirme ce scénario pour le moment excepté un arrêt très momentané de la baisse, il serait intéressant de surveiller les habituels signaux de fin de tendance : réactions fortes et volumiques, formation d’une consolidation, baisse du momentum, rupture de la ligne de tendance caractérisant le mouvement

Lire la suite
BTC Bounce soon pour COINBASE:BTCUSD par Azwawwww

BTC Bounce soon par Azwawwww

COINBASE:BTCUSD

I would like to see your opinion about this trendline on weekly TF (Log) we should be on a bottom right now since every indicators are down and people are expecting 30K and continue to short, a shortsqueez should send them off the game

Lire la suite
TradingGroundhog Top-Bottom Long Term Idea pour BINANCE:LINAUSDT par TradingGroundhog

TradingGroundhog Top-Bottom Long Term Idea par TradingGroundhog

Simple Idea.
Using the Top/Bottom fractals, and investing during uptrending bottom, non-negligable positive ratio can be awaited. This idea will be followed by another one taking advantage of short term fractals.
Blue lines describe top flow and red describe bottom flow. When an untrending bottom flow meet a downtrending top flow, bull period will tend to occur.

Lire la suite
BTC : Possible BOTTOM dans cette zone stratégique des 33300 pour COINBASE:BTCUSD par Elliott_Wave_Analysis_France

BTC : Possible BOTTOM dans cette zone stratégique des 33300 par Elliott_Wave_Analysis_France

Le BTC est finalement venu chercher les 100% de retracement du running et il pourrait s’arrêter là. La structure Elliottiste reste bullsih avec sommets/creux ascendants en daily/weekly. Cette C aurait été formé par une ending diagonal (divergente) et l’objectif des 100% de la vague 5 a déjà été atteint. La sous 5 de cette ending est formée par un zigzag et la vague C du zigzag par une impulsive baissière qui pourrait être terminée selon un décompte avec une vague 3 au 161.8 de retracement. Donc possible bottom là où nous sommes. Si le cours devait retracer davantage alors nous serions dans un Expanding et non plus un running MAIS tant que l’on n’a pas cassé les 30000 alors on reste dans une structure bullish (sommets/creux ascendants). EWAF

Lire la suite
XLM IL Y A DU BON ET DU MAUVAIS ! pour KRAKEN:XLMUSD par Aicky92

XLM IL Y A DU BON ET DU MAUVAIS ! par Aicky92

la bonne nouvelle c’est que XLM construit une structure bullish, wedge pattern,
mauvaise nouvelle, on a cassé le low de juillet ce qui me dérange un peu…

on est clairement sur un mouvement de capitulation.. la peur est au maximum, historiquement quand la peur est a son max, une reversal apparé..

Lire la suite

Recevez un plan d'investissement Crypto personalisé